Predicting the Future
Feb 1, 2023

One of the tricky things about a new game launch is projecting revenue into the future. Sure, your first few users spent money or watched ads, but how long will that last? How does revenue grow over time?
It’s always difficult to make predictions, but fortunately there's a secret law in mobile gaming; an iron rule that you can apply to guess how your game is going to grow. Let's break it down.
First, you need to be cohorting your users. Cohorting means that you divide users into groups based on when they installed the game, and then look at how the users from each group performed over time.
For example: maybe 250 users installed your game on January 1st, 2023. You can then follow that group of users, and calculate cumulative statistics about them over time: How many of those 250 users logged in on January 2nd? Dividing this number by 250 gives you D1 retention.How much ad revenue did your users generate by January 8th? This gives you D7 revenue, and you can divide it by 250 to get D7 ARPU, or average revenue per user.
This means that for each cohort group you can track ARPU, retention and ROAS (return on ad spend) - and then compare D7 or D30 ROAS between different cohorts. But this doesn't help us project the future. If we have a 40% D30 ROAS, what is it going to be after six months? Or a year? To solve this problem, you need to project your revenues.
Some trends are linear - we assume they're going to keep going in the same direction, and we can use linear regression to guess what's going to happen next.

But in mobile gaming, revenues are not linear - on average, across a cohort, users log in more and watch the most ads in the first few days after they install; things then get worse over time. That means if we use linear regression, we're going to massively overestimate future revenues! However, data scientists at top mobile gaming companies have a secret sauce - they've worked out the iron law behind all these curves.
Cumulative revenue is log-linear. And so while LTV modelling with machine learning requires a ton of past data, you can get started on this simple model with just a few data points. What does that mean?
A log-linear curve flattens out over time. For example, see the curves below - they look like they could be ROAS or ARPU curves.

The curves below also flatten out over time, but in the other direction; they could represent retention.
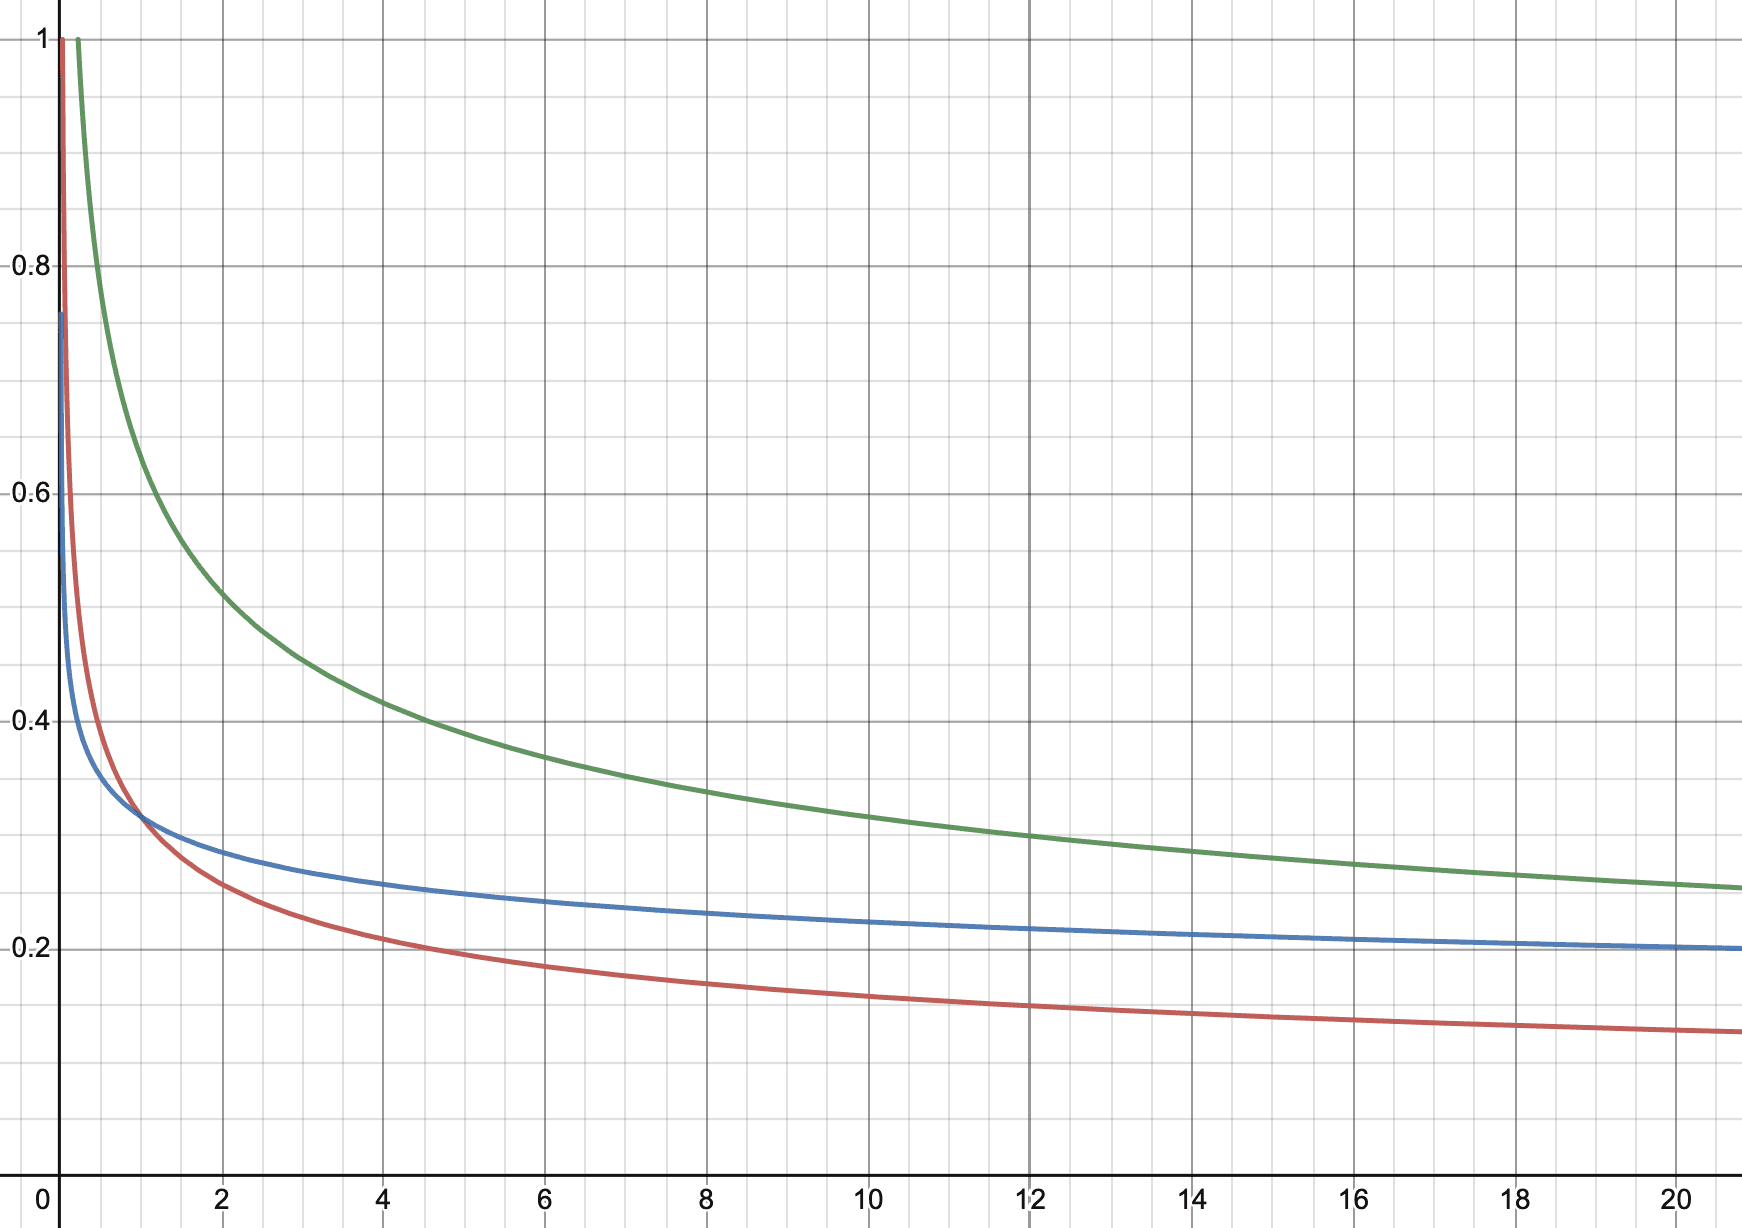
But if you plot the x- and y-axes on a log scale, these curves become straight lines. This means you can apply normal linear regression, and then go back to a normal axis to see what your predictions generate.
If that sounds complicated, it doesn't have to be. We've built a free template spreadsheet that you can use to project out early cohorts.

If you found this tool useful, then you're going to love our main product - schedule a meeting!